Componentisation is the process of breaking down a document into it's constituent Components.
The founders of Blue Curve realised in the late 1990's that financial research was compiled into a document partly down to the historical need to distribute research on paper. Of course, there were other reasons, such as the need to "tell the story", and to meet regulatory demands. But the idea that everything had to be in a document seemed to belong in the past.
The opportunities for distributing research in different ways opened up in the 90's, and this lead to the idea of Componentisation. It was still important for the analyst to write a "document", because that was the easiest way for them to tell their story. But storing the individual Components of the document in a database, made it a lot easier to distribute the content in different ways and respond to the changes in customer demand.
Components in Blue Curve
We pioneered the idea of Componentisation in the early versions of Blue Curve, and it's grown to become a core design feature of the system. As a result, the idea is inherent in many things that Blue Curve does.
Components are simply pieces of text, tables, charts and images. Combined together, they form pages, sections, chapters and documents.
Blue Curve has the ability extract Components from documents and store them in the database, along with the information required to combine them in the correct order. This provides the ability to create any format of output
Components in Templates
When creating a new piece of research, Blue Curve presents the analyst with a partially completed document. This is built dynamically using a template and two types of Components.
Defined Components are those parts of the document that can be defined by their name or purpose. Quite often they'll contain data that is integrated with the Insight module, such as a Key Data table or a Share Price Performance chart. They may also be free format, allowing the analyst to add content directly, such as an Investment Summary. They key benefit of a defined Component is that it's type and format is known to the system. This in turn allows the system to provide more functionality when it's used in output. For example, defined components can reformatted and be positioned more precisely in output formats (Emails, web pages etc).
Undefined Components are generally those parts of the document written and created by the analyst. They still include text, charts, images and tables, but they are not uniquely identifiable in the same way as Defined Components. This limits their use a little, but still allows the content to be filtered, reformatted and used in different output files.
Blue Curve can also use Component content from previously published documents as the input to a new document.
Components in Output Formats
Although analysts generally use Microsoft Word and Powerpoint to create their content, the Email and HTML output formats are generally created using the Components. This provides the ability to lay out the content in a format that works well on each target device. By repositioning Components it's possible to make the content work better on mobile devices, whilst still retaining the original layout for printing or PDF formats. It's also possible to introduce content drill-down on web-based devices to make the content more usable, rather than deliver the entire document in one hit. Charts can also be interactive, and tables can be expanded. In fact, using Components in Blue Curve it's possible to automatically produce very sophisticated electronic research formats from a Microsoft Word file, and with virtually no manual effort.
Defined Components also have an audit history. You can create web pages to show the Component content from the latest document, but also scroll back in time through previous versions.
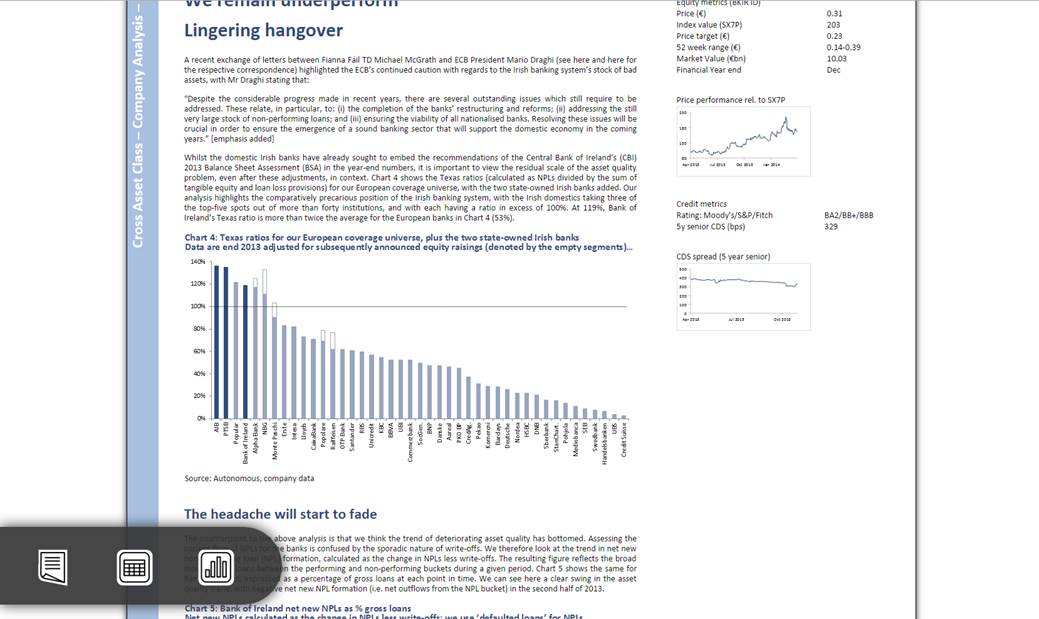
You can display an entire document on a web page as Components. You can use "floating navigation" and drilldown to go to relevant content more quickly.
Clicking the Table icon on the floating navigation displays just the tables in the document. The same can be done for charts, Defined Components and more.


